Threat Analytics
Operation & Analytics > Threat Analytics tells what the protections of the firewall did: what was blocked or detected, when, where it came from, which devices inside the network were affected and why. It runs on the firewall itself, with no cloud service.
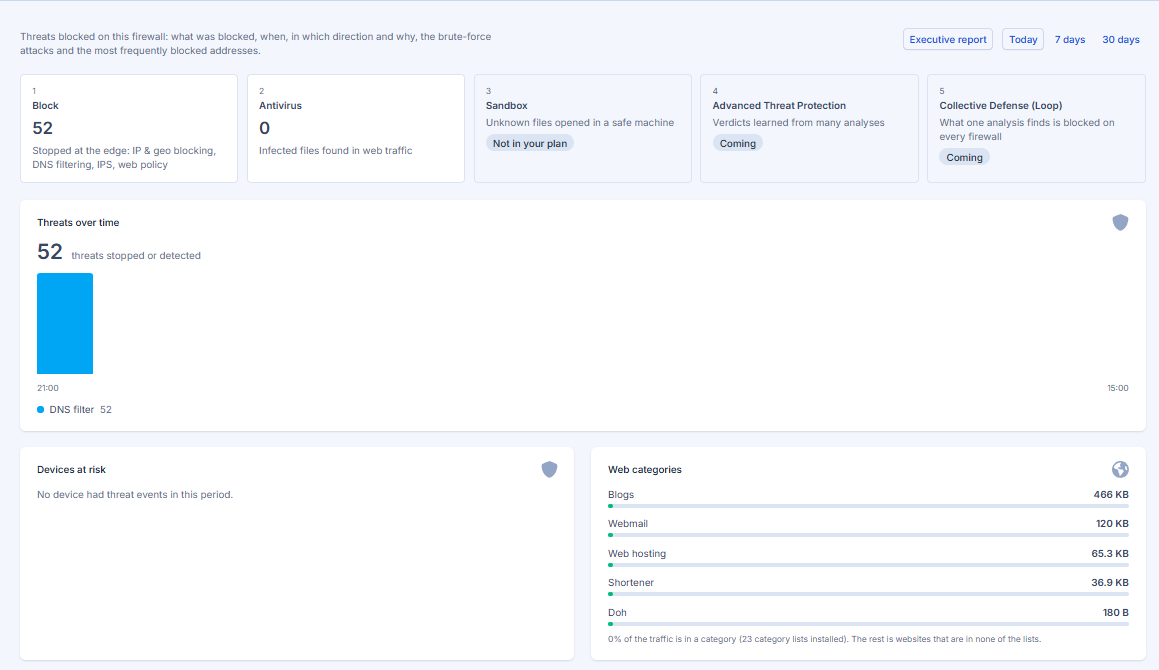
Choose Today, 7 days or 30 days at the top right.
The story of a threat
The first block follows the layers a threat meets, in order:
| Layer | What it counts |
|---|---|
| Block | Stopped at the edge: IP and geo blocking, DNS filtering, IPS and the web policy (categories and the content filter) |
| Antivirus | Infected files found in web traffic |
| Sandbox | Unknown files opened in a safe machine, see Web Protection |
| Advanced Threat Protection | Verdicts learned from many analyses. Not available yet: the tile shows Coming |
| Collective Defense (Loop) | What one analysis finds is blocked on every firewall. Not available yet: the tile shows Coming |
A layer that is not in your plan shows Not in your plan.
What else is on the page
- Threats over time, stopped or detected, with the change against the previous period.
- Devices at risk: a score per device (weight of the protection that acted, times the severity, times the number of events). The weights are printed under the table.
- Web categories: the traffic by category of website. It also says how much of the traffic is in a category, because websites that are in none of the lists are not counted in one.
- Most affected devices, top threat sources and top reasons.
- Events: every event with its time, device, remote address, protection, action (blocked, detected or allowed), reason and detail. Search by device, address or reason, and open an event for its detail.
The events are kept on the firewall for 35 days. The history starts when the version that introduced this page was installed.
Executive report
Executive report (button at the top) makes a PDF for the selected period: an executive summary, the threat events, the devices at risk, the traffic, the web categories, the state of the protections and recommendations. It is free in every plan and carries only a small Powered by Nexwall mark.
By default the devices appear as Device 1, Device 2 and so on. Turn on Include device names and addresses to see their names and addresses.
Related pages
- Dashboard
- Traffic Analytics
- Logs for the raw events in the Log Viewer.